Reports overview
Definition
The Reports section is used to generate and access statistics about the performance of traffic campaigns.
Interface
The section is split into eleven presets.
Campaigns/Pre-landers/Landers/Traffic sources/Country/City/Browser/Devices/OS: show data about campaigns/pre-landers/landers/etc.
Conversions: contains statistics about campaign conversions.
Clicks: displays information about campaign clicks.
The resources grid
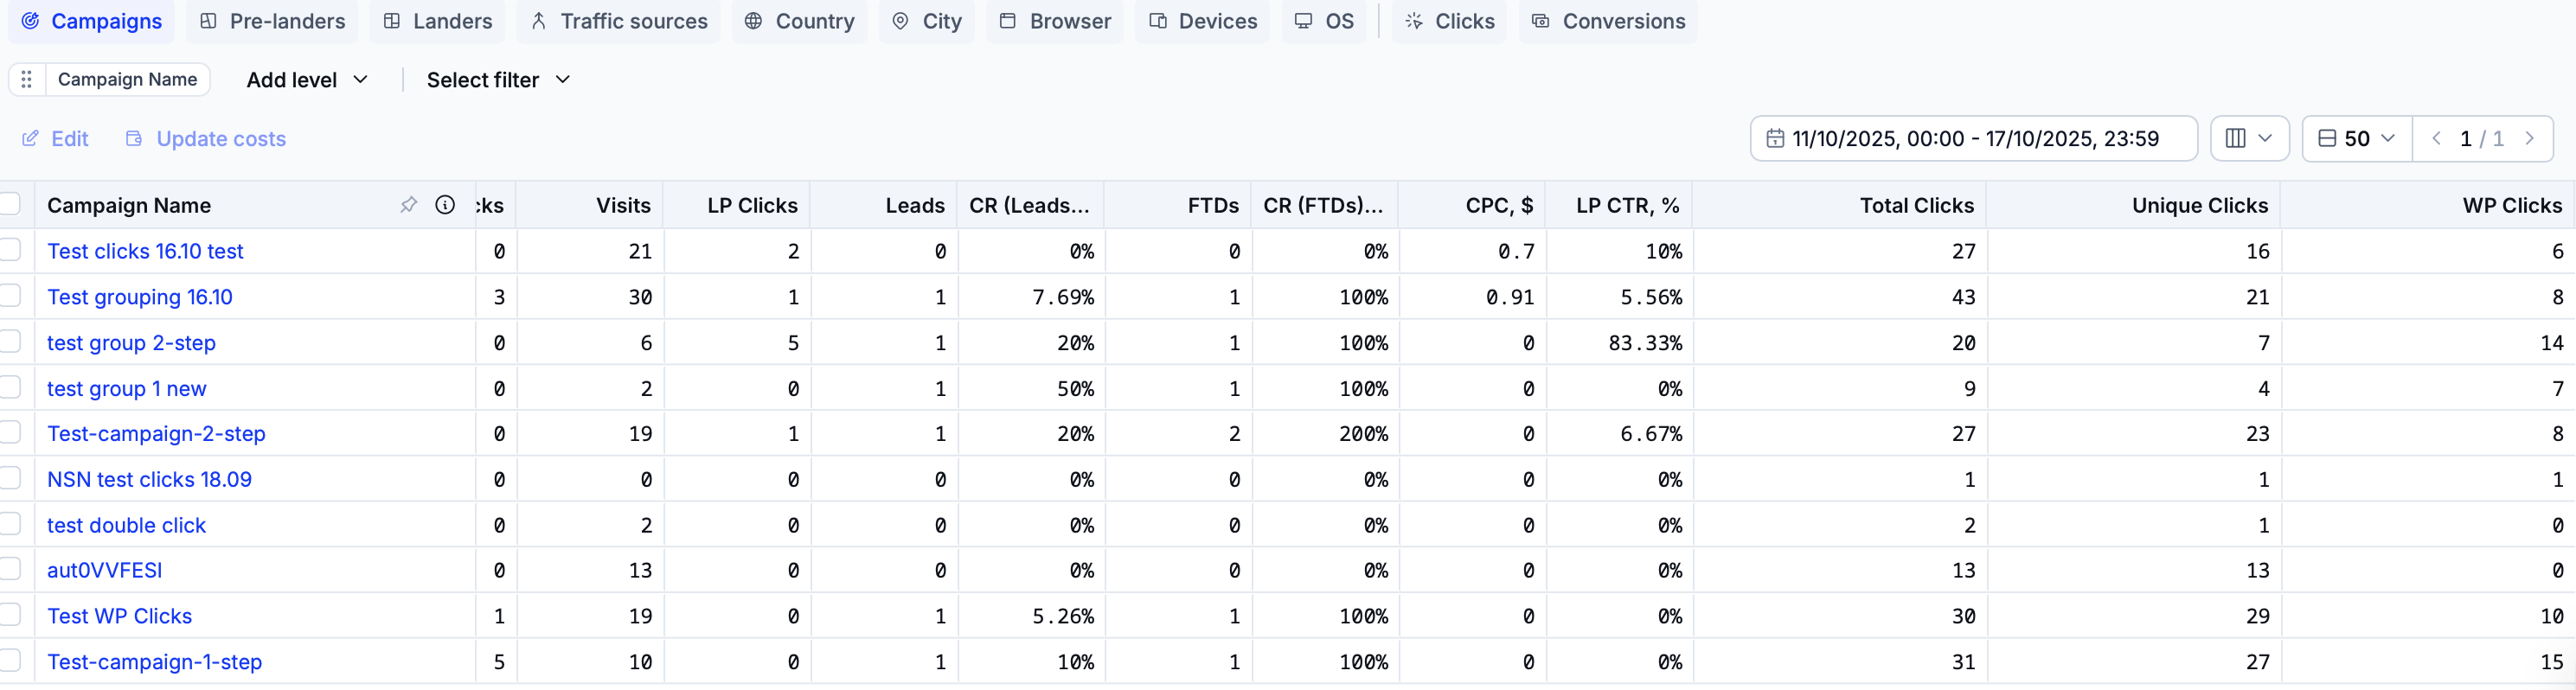
The grids in the first nine presets in the Reports section display financial statistics grouped by resource type.
Column name | Definition |
|---|---|
Campaign Name/Pre-Lander Page/Lander Page/Traffic Source/Country/City/Browser/Device Model/OS version | The name/identifier of a specific resource. |
CPC, $ | The cost-per-click of the campaign. |
Total Visits | The total number of clicks on the campaign link. This number includes bots and valid traffic. |
Visits | The total number of ‘clean’ clicks on the campaign link that passed filtering and reached the campaign template(s). |
LP Clicks | The number of users who clicked on the link in the pre-lander and accessed the lander template. |
LP CTR, % | The campaign’s landing page click-through rate. |
Bot Clicks | The total number of clicks blocked by the cloaker engine. |
FTDs | The number of first-time deposits generated as part of the campaign. |
Leads | The total number of leads generated during the campaign. |
CR (Leads to FTDs, %) | The percentage of leads converted into FTDs. |
CR (Leads to Offer Clicks, %) | The percentage of leads converted into offer clicks. |
Unique Clicks | The total number of all unique clicks that interacted with the campaign. |
WP Clicks | The total number of clicks that reached the campaign white page as part of the default flow or if the ‘All traffic to White Page’ option was chosen when configuring the campaign. |
Info
All grids in these presets display a ‘totals’ row below all other rows. By default, this row shows the totals of all cells in its respective grid.
If one or more rows are selected in a grid, enable the ‘Show selected’ switch to only show the totals of the cells in these rows.
The conversions grid
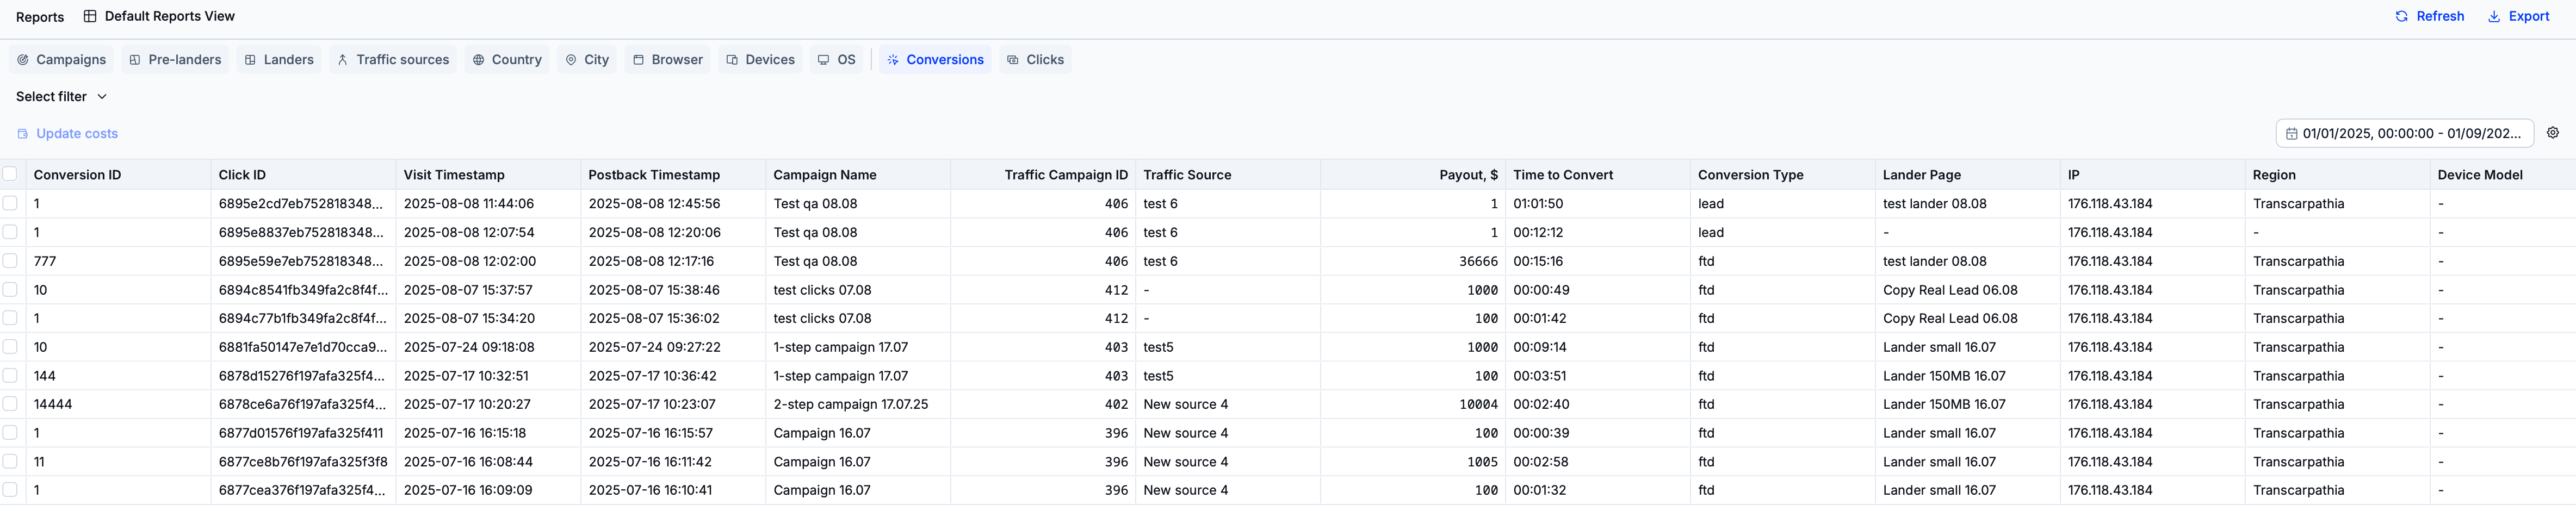
The grid in the Conversions preset displays data about campaign conversions.
Column name | Definition |
|---|---|
Conversion ID | The unique identifier of the conversion. |
Click ID | The unique identifier of the click that created the conversion. |
Visit Timestamp | The date and time when the visit that created the conversion was registered. |
Postback Timestamp | The date and time when the postback event corresponding to the conversion was triggered. |
Campaign Name | The name of the campaign that generated the conversion. |
Traffic Campaign ID | The unique identifier of the traffic campaign that generated the conversion. |
Traffic Source | The traffic source that provided the conversion. |
Payout, $ | The amount of USD paid for the conversion. |
Time to Convert | The time difference between the postback timestamp and the visit timestamp. |
Conversion Type | The conversion type (either ‘Lead’ or ‘FTD’). |
The clicks grid
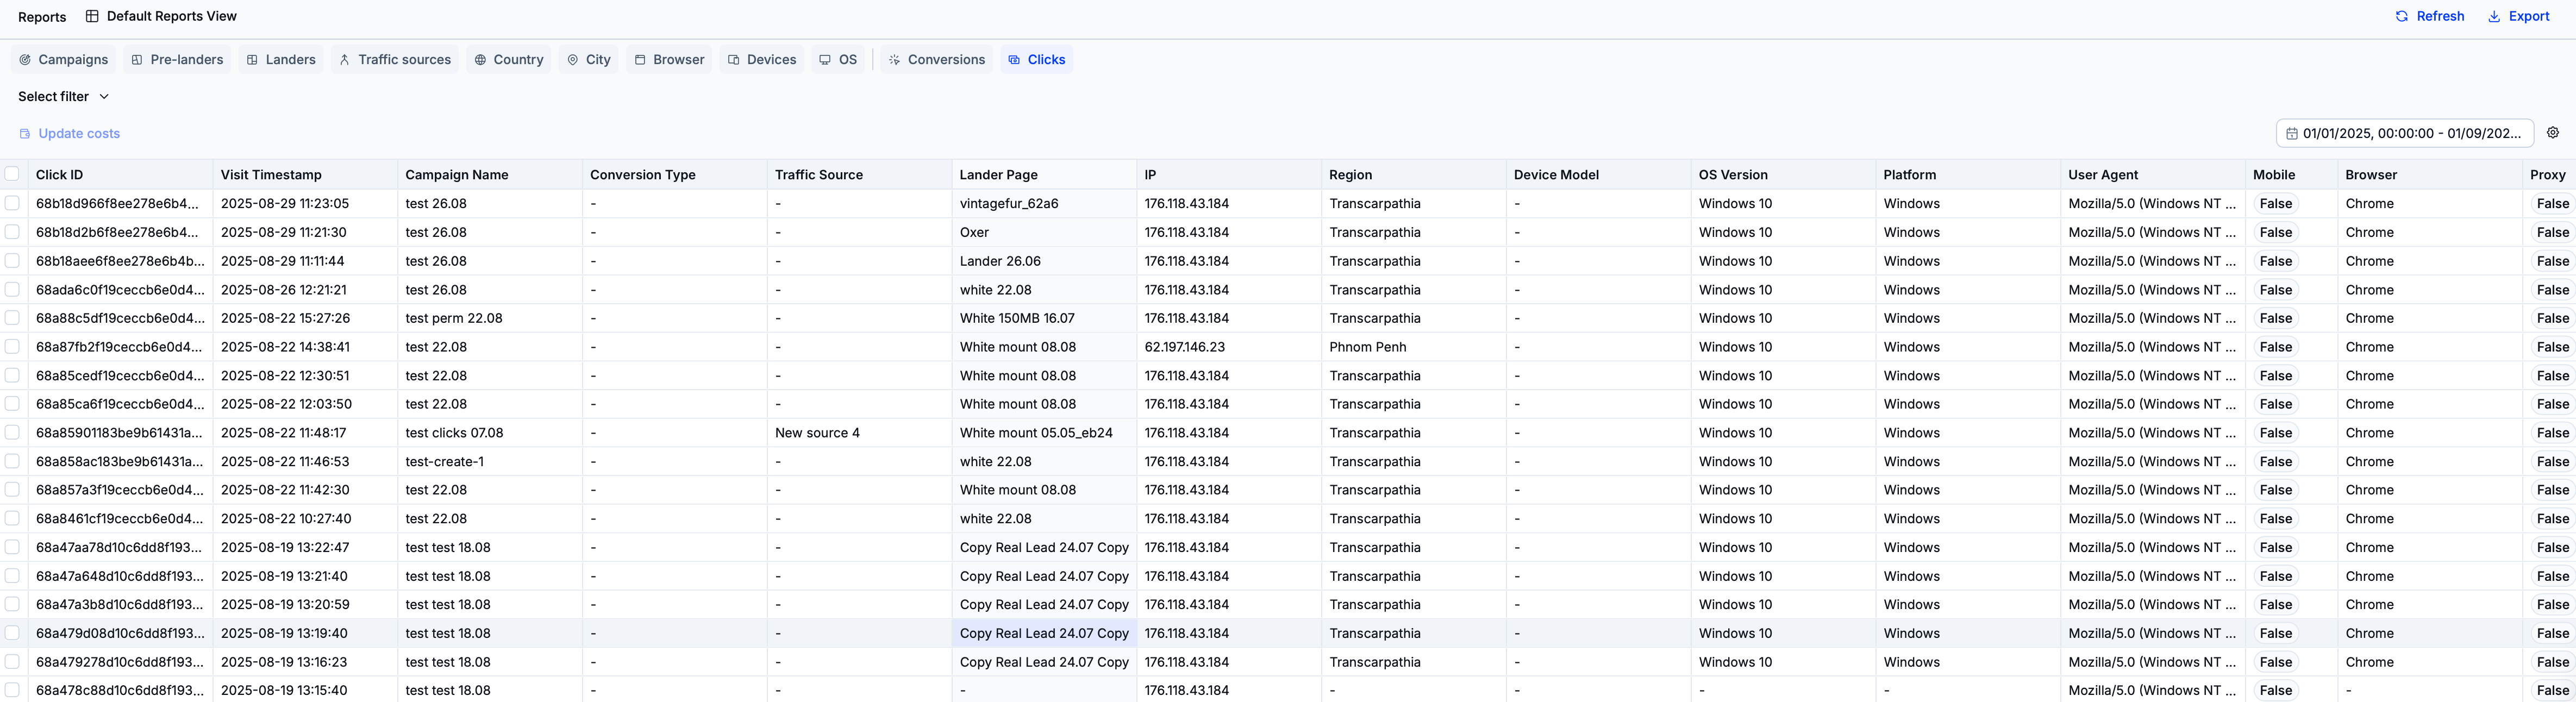
The grid in the Clicks preset displays statistics about campaign clicks.
Column name | Definition |
|---|---|
Click ID | The unique identifier of the click. |
Visit Timestamp | The date and time of when the click was recorded. |
Campaign Name | The name of the campaign which generated the click. |
Traffic Source | The name of the traffic source that provided the click. |
Lander Page | The lander template that the click accessed. |
IP | The IP address from which the click arose. |
Region | The region where the click originated. |
Device Model | The device from which the click originated. |
Key actions
Read the following tutorials to learn more about working with reports.